Air temperature records continue to be broken, according to reports from the EU's Copernicus Climate Change Service.
As we try to get our heads around the massive issue of Climate Change in general, every year on 21 June people are asked to Show Their Stripes.
Created by Professor Ed Hawkins from the University of Reading, the global warming stripes are a simple visual representation of the long-term rise in global temperatures.
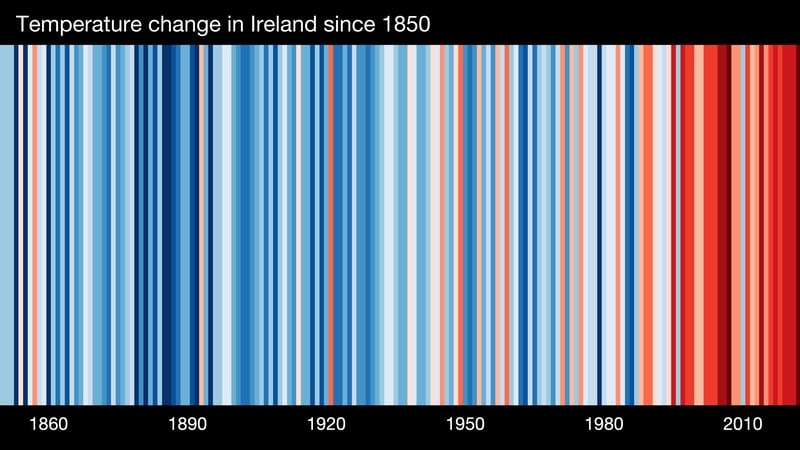
The image above shows temperature change in Ireland since 1850, but you can visit the official site and look at the global view or pick other continents and countries to see what is happening there.
Visit the official site here to explore more charts from Ireland and around the world.
Each stripe represents the average temperature for a single year, relative to the average temperature over the period as a whole. Shades of blue indicate cooler-than-average years, while red shows years that were hotter than average.
The stark band of deep red stripes on the right-hand side of the graphic shows the rapid heating of our planet in recent decades.

The story of the stripes
Prof Ed Hawkins explains: "The first time they were used at an event was actually a literary and arts festival in Wales - the Hay Festival. They were keen to do something in relation to climate change and the environment, so scientists were invited along with artists and poets like Nicola Davies who I was speaking with on the day.
"I was looking for a simple way to show an audience what was going on, bearing in mind this was not a science festival. It was a case of showing the science as simply as possible and the stripes seemed like a good idea. When they went up on screen you could see people's eyes open up and they were really engaged.
"The stripes I created were from the area of Hay, and it helped people see climate change where they live. We normally see it in a global context, but the fact you can have local stripes means we look at it in a new way. When we feel the effects of climate change it can be seen in the stripes, even looking at the Ireland chart."
For young people interested in Climate Action subscribe to the Ecolution podcast here!

